Phosphorescence spectrometry of diamonds

By Jean-Pierre Chalain, first published in Facette 30 (March 2026)

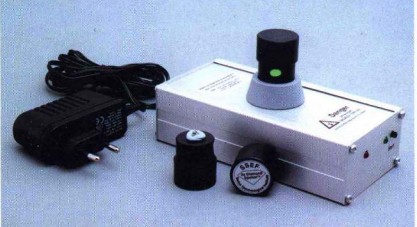
The JASCO FP-8550 spectrofluorometer. The instrument has a variety of applications. Here, we report on the phosphorescence lifetime study of a 0.705 ct, round, brilliant-cut, colourless (H/VS1), natural diamond (reference NBMJ).
Figure 1: Spectrum (blue large dots) of the phosphorescence decay of the 455 nm band of a natural diamond excited by the 225 nm lamp of a JASCO spectrofluorometer FP-8550. The spectrum data points exported into Excel fits well (R2 = 0.996) with the exponential theoretical curve y = 268.38e-0.128x (red dash), where 268.38 is the original intensity of the emission (when emission stops) and 0.128 is the reverse of the lifetime, thus τ=7.81 ms. Spectrum: SSEF.

Phosphorescence lifetime

Gemmologists will recall that fluorescence is the light emitted by a gem during excitation (traditionally with UV light). Phosphorescence is the light emitted by the gem after excitation has stopped, decaying exponentially over time.

This exponential decay can be characterised by its time constant, denoted by the Greek letter tau (τ), which is the rate at which the intensity of phosphorescence decreases over time.

The following formula describes the intensity of phosphorescence at time t: I(t) = I0 . e-t/τ
where: I0 is the initial intensity, t is time, and τ is the time constant of decay. The lifetime is the time constant of this exponential decay; therefore, after fitting the decay spectrum to an exponential function, the value of lifetime is given by 1/t.
To record the phosphorescence lifetime of this gemstone, we used the JASCO ‘Phosphorescence Lifetime’ application programme in the Spectra ManagerTM Suite, which is designed for molecular spectroscopy.


Instrument setup

To measure its phosphorescence, we excited the diamond with a deep UV wavelength of 225 nm and recorded the intensity of light emitted at 455 nm. The aperture in front of the excitation light beam was fixed at 5.0 mm, with the diamond placed table-down at the centre of the sample holder.
Measurement of the phosphorescence starts as soon as the diamond is excited. After 33.4 ms, a shutter blocked the excitation light and the phosphorescence decay was recorded by the detector every 0.1 ms for 36 ms.


Results

After fitting the measured spectrum to an exponential theoretical curve, the ‘Spectra Analysis’ application automatically provides the lifetime. However, for illustration purposes, the data points of the spectrum were exported to Excel and fitted to an exponential curve (Figure 1). The equation of the fitted curve enables calculation of the lifetime (τ = 7.81 ms).

References

McGuinness C. D., Wassell A. M., Lanigan P. M. P., Lynch S. A., 2020. Separation of natural from laboratory-grown diamond using time-gated luminescence imaging Gems & Gemology, Vol. 56, No. 2, pp. 220–229, http://dx.doi.org/10.5741/GEMS.56.2.220